|
|
|
|
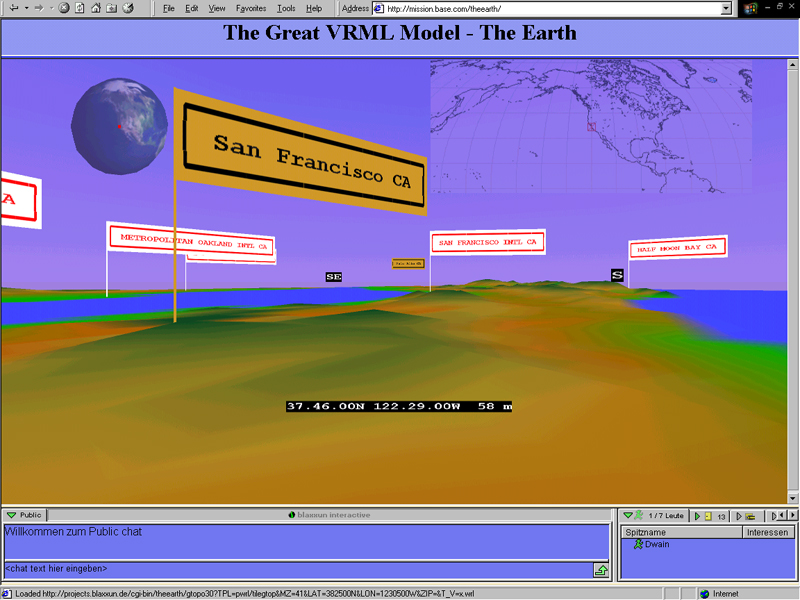
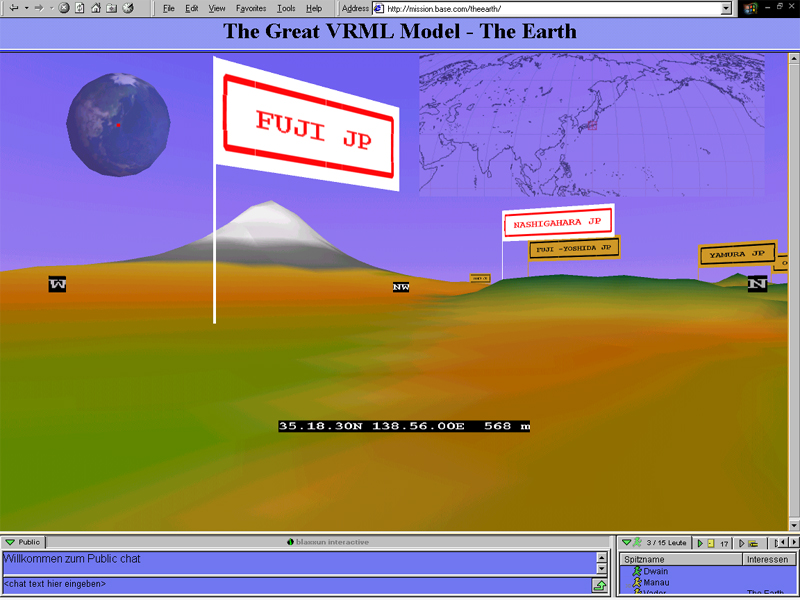
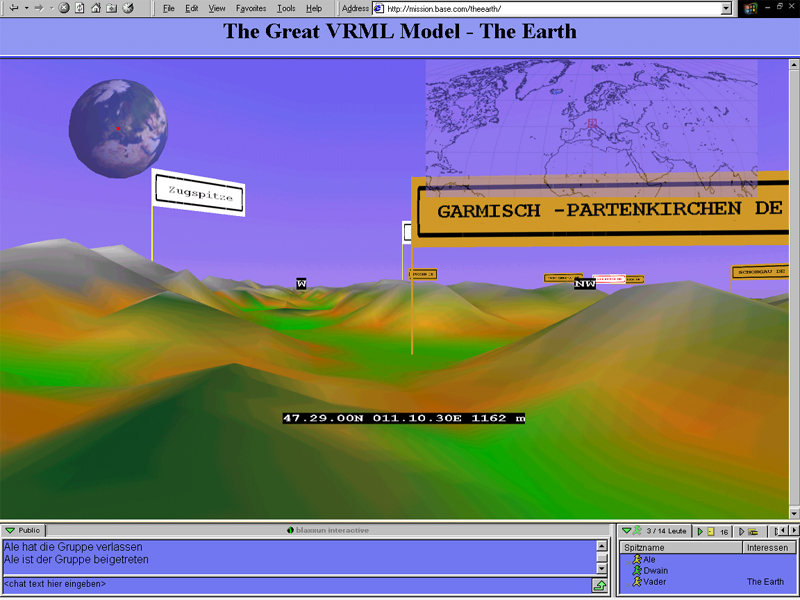
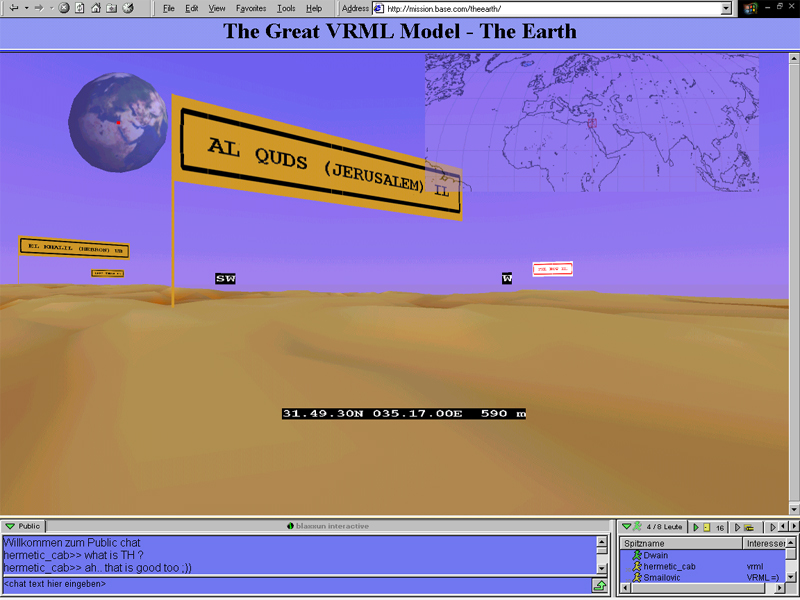
| San Francisco | Mount Fuji | Bavarian Alps | Jerusalem |
The Great VRML Model - The 3D Earth also displays populated place information of about 90000 places derived from the Digital Chart of the World data set published by the Pennsylvania State University.
The Great VRML Model - The 3D Earth consists of about 800 million polygons that get seamlessly downloaded while you browse the model.
Enter the name of a place and SEARCH for it:
Or select a place where you want to start: A random place on earth
Or enter the latitude and longitude
of a place in degrees and minutes and hit SUBMIT:
|
|
|
|
|
| San Francisco | Mount Fuji | Bavarian Alps | Jerusalem |
The model covers the planet earth from 179 Deg West to 179 Deg East and from 60 Deg South to 90 Deg North.
You cannot walk over the 180 Deg E/W line and I do not know what happens if you go further north than 90 Deg and further south than 60 Deg.
E.g. the cgi request url gtopo30?TPL=pwrl/tilegtop&LAT=480000N&LON=0120000E fetches the data of one tile located at 48 North, 12 degrees East.
Seriously, I did this project for fun and I enjoyed it very much, so if you have a data set that promises to show something new I am more than happy to collaborate.
If you move too fast or your internet connection is too slow you will notice that the tiles are not loaded underneath or in front of you. Stop moving and wait a little while in this case.
The data of the DCW is at least 10 years old, therefore a lot of names are not correct anymore. If you know of any better data that is available on the net please let me know.
I entered a couple of names of lakes ( blue flags ) and mountains ( white flags ) by hand because I could not find any other source.
If anybody knows about a source that maps names of mountains and lakes to latitude and longitude in degrees and with a resolution of at least 30 arc seconds please let me know.
Lat    Lon      P Name    Country
480827N0113234E P MUNCHEN DE
I will include it.
The program reads a 41 by 41 elevation point square with the given location at the upper left corner from the GTOPO30 data. The number 41 is a value that I defined, it leads to a sub tile with 1600 vertexes. 9 of those subtiles are displayed at any given time, my computer can handle the 15000 vertex VRML model resulting but not much more :-).
With 30 arc second grid spacing of GTOPO30 the nine subtiles together exactly display one square degree.
Next the program assigns the color values to the points. Hilltops, slopes and valleys get different color values, the color depends also on the location of the data on earth and on absolute altitude. Lakes and the sea are blue. The algorithm is rather complex, heuristic, unscientific and from me. ;-)
The program retrieves the place names of all places that are located on the tile printed.
Last the program prints a VRML template and fills the heights and color values into an ElevationGrid with colorPerVertex color. The flags for the places located on the tile get also printed to the VRML. The resulting VRML file gets gzip'ed on the fly and then sent on its way to your browser. The gzip'ed sub tile VRMLs are between 5 and 10 KB.
In order to display the entire scene the program gets called with a request
to print the main world first.
/cgi-bin/gtopo30?TPL=pwrl/gtopo30&LAT=480000N&LON=0120000E.
This uses a different VRML template for the main world.
The main world VRML in turn calles the program 9 times to print the 9 subtiles.
The main world VRML also contains the code that loads the tiles needed while you walk around. This code is written in VRML script.
Thank you to the Pennsylvania State University for making the Digital Chart of the World data set available on the net.
Thank you to Google for their wonderful search engine.
Thanks to the web 3D consortium for providing the mailing list and the GeoVRML working group.
Thanks to Teresa Reuter for consulting on the color schemes.
Special thanks to Holger Grahn for writing the best VRML browser and for support on VRML questions.
And last not least thanks to Robert G Stein for supplying the music for the project.
copyright c 2001 - 2007 by Peter Graf